

No sting in September, but October awaits
One of the reactions is to lament the missed shorting opportunities

SEPTEMBER, where is thy sting? Statistically, the month records major retreat in US markets. It is just one of the three months that on average delivers negative returns and has by far the largest fall.
However, despite a range of negative developments, including an acceleration of the war in Gaza and the opening of new war front in Lebanon, the markets seemed immune to the so-called September curse.
The antidote to the September sting was the US interest rate cut. Justified or not, it spurred markets into a resumption of the uptrend. Even the Chinese market got excited, surging more than 10 per cent in response to the People’s Bank of China’s rate cut and delivering a severe sting to China shorts.
There are two potential reactions to the absence of September sting. The first is to lament the missed shorting opportunities. However, it is in the nature of calculating an average that both bullish and bearish events will be included. This year fell on the bullish side.
The second reaction favours the bears. Proponents point to the rapidly accelerating US debt. Current interest payments are more than US$1 trillion a year. They point to increasingly high valuations in the US markets, the widening war in the Middle East and the weaponisation of common electronic products.
Their conclusion is that in the US, the September sting has not been neutralised, but rather delayed. The pessimists remain ready for a bearish October and rebound. History gives some credence to this approach as October often includes dramatic down days, even though October usually closes higher by the month’s end.
Potential for pullback
While September or October collapses are sometimes triggered by seemingly innocuous events, the potential for a pullback is usually identified earlier in the charts. We look at the more accurate S&P 500 index for any evidence of fear.
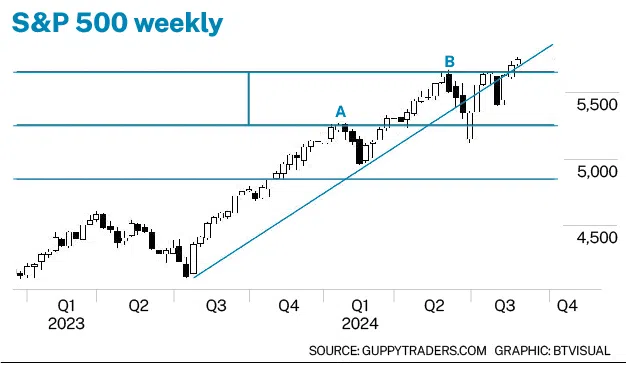
The August dip broke the uptrend line that had defined market activity following the (surprise, surprise) October dip in 2023. The position of the line was confirmed with the second anchor point in April 2024. The August dip below the trend line changed the nature of the role played by it. Prior to August, it acted as a support feature. Following that month’s dip, it acted as a resistance feature. Currently, the index is hugging the trend line.
The April dip potentially identified the start of a head-and-shoulder reversal pattern. Point A was the potential shoulder and point B the potential head. The pattern was invalidated when the index rose above the value of point B.
The pessimists now treat point B as a potential left-hand shoulder of the pattern.
Trading band analysis
A useful guide is provided by trading band analysis. These bands are not plotted precisely, but they provide a good indication of support and resistance areas. This sets the immediate upside target near 6,600 as each trading band is around 400 index points wide. October still lurks, so a sharp downside move has support near 5,260.
China, long subject to predictions of gloom with a near 12-month market collapse, delivered a September sting to those shorting the market. The index chart suggests that although the fast spike will inevitably retreat, the move also signals a change in the trend. This is best seen on the weekly chart.
Shanghai Composite Index’s behaviour is characterised by very sharp moves between broad trading bands. These bands define support and resistance levels, but they are approximate levels subject to frequent overshoots.
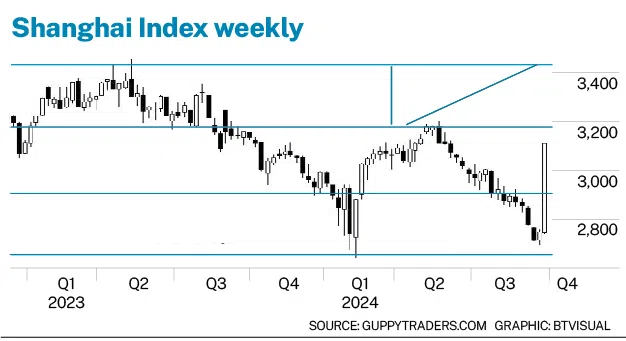
The current rally comes from near support around 2,650. Like the US market, the index reacts to changes in the central bank’s fiscal and monetary policies. China reactions tend to be more pronounced.
The upper edge of the trading band near 2,890 offered little resistance to the current rally. However, this is a support area for any rally retreat. Using the width of the trading band, the next target level is near 3,150 with the potential to briefly test the previous highs near 3,170.
Although the chart pattern is not a true double bottom, the calculation for this type of pattern can be applied with caution. These calculations also suggest that 3,150 is a rebound target. However, this does not define how the market will achieve these levels, so traders are ready for a rapid move, or a flattening of the uptrend.
In the US, September had no sting, but it’s an unusual market that delivers year-long benign outcomes, particularly in the face of increasing global uncertainty. US investors will remain alert for a cleansing purge of market readjustment. It may not signal a change in trend, but it will lead to a healthy and more sustainable uptrend.
Investors stung by China’s September recovery will look for entry opportunities on market pullbacks.
The writer is a financial technical-analysis specialist, equity and derivatives trader and author. He has developed leading technical indicators used by investors in many markets.
TRENDING NOW

Higher rates, weaker spending: Is the Philippines entering stagflation?

China recruited exec at Singapore data centre firm to spy on Nvidia CEO Jensen Huang: US intelligence

Could Japan trigger the next global financial crisis?

Philippines’ FDI slowdown exposes uneven investment prospects across S-E Asia

