

The US dollar and its impact on markets
A stronger greenback benefits US importers, while a weaker currency has the opposite effect
THE US dollar remains a reference point for global trade. Its rise or fall in relative value has significant economic impacts. Countries that peg their currency to the greenback find themselves in thrall to its movements.
Here’s a brief summary of the impacts of US dollar strength or weakness from an American perspective.
A stronger greenback benefits US importers, including those who import goods from China. Mainly, it benefits American foreign products as they become cheaper in US dollar terms. This acts as a damper on inflation.
A weaker US currency has the opposite impact. American export products become more competitive and affordable, which can increase foreign demand.
Goods imported into the US become more expensive, adding to inflationary pressures. This is even more evident when tariffs are added; the American consumer pays the extra cost. The inevitable inflationary pressure is managed with interest-rate hikes.
With a weaker US dollar, companies with significant overseas operations report higher profits because foreign currency-denominated earnings translate into more dollars. The most visible impact is a rising S&P index, where many of these companies are listed.
Below parity
The industry measure of the greenback is the US dollar index (DXY), which provides an external, trade-weighted average value of the currency against global peers. It includes the euro, yen, pound, Canadian dollar, Swedish krona and Swiss franc.
It’s difficult to justify the relevance of krona in this mix in the globalised economy. However, the DXY is a standard currency index watched by markets.
The “Goldilocks” DXY valuation should be at parity when a single US dollar is valued on the DXY at 100 cents. US policy decisions have relentlessly driven the value of the greenback downwards and below parity during 2025.
This decline was one of the factors driving the S&P 500 up during the same period. Although the relationship is not a direct link, investors should not discount the impact on S&P behaviour.
The DXY short shows three strong support and resistance areas at 96.5, 100 and 106 cents. The dollar has been oscillating between the lower band values for several months. Every rally towards parity at 100 cents is forced back, and the index drops towards support at 96.5 cents.
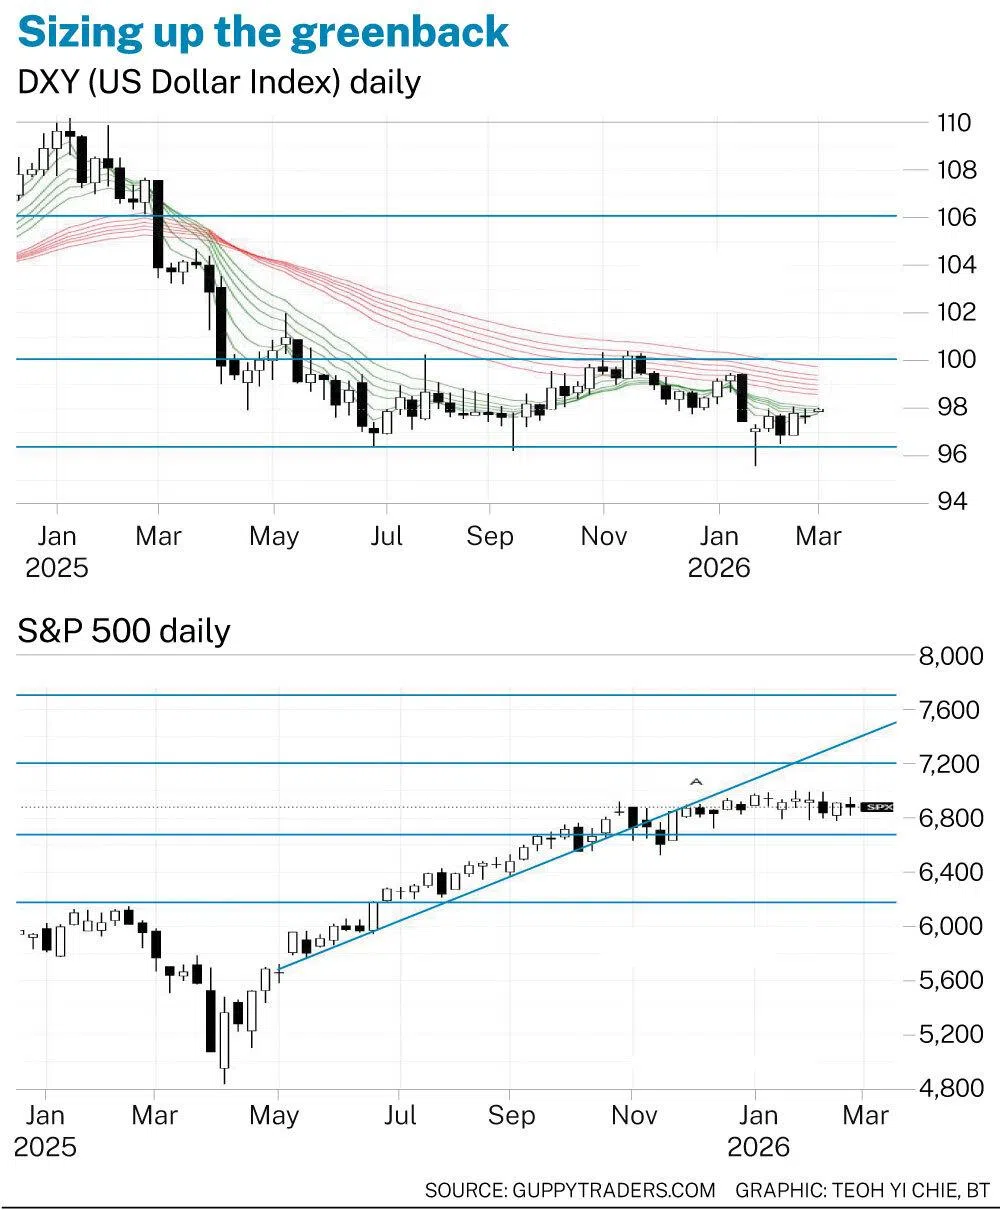
The Guppy Multiple Moving Average indicator shows a wide separation in the long-term upper group of averages. This confirms strong downtrend pressure, which suggests the US dollar will remain around the lower values below parity.
The indicator relationships suggest there is a low probability of the greenback moving above parity.
The S&P chart and, to a greater extent, the Nasdaq chart show some weakness in the trend behaviour. This suggests the lifting effect of a weaker US dollar is not translating as smoothly into profits as it has in the past.
The S&P chart shows a prolonged sideways movement around 6,900. Support is near 6,680. Resistance is near 7,200. There is no indication of a resumption of trend momentum towards 7,200.
This does not preclude fast index movement in reaction to the attack on Iran. What is significant is that the previous long-term trend behaviour has ended.
A breakout above resistance near 7,200 faces two resistance features.
The first is the projected value of the uptrend line A. This is currently near 7,360. A move above this level has a calculated trade-band resistance near 7,700. This is calculated by measuring the width of the trading band and projecting the value upwards.
The reduction of S&P and Nasdaq index momentum while the DXY is weak is contradictory. The contradiction is often resolved with some violence in the market with sudden adjustments. It makes good sense for investors to watch this DXY relationship in 2026.
The writer is a financial technical analysis specialist, equity and derivatives trader, as well as an author
TRENDING NOW

China recruited exec at Singapore data centre firm to spy on Nvidia CEO Jensen Huang: US intelligence

DBS, OCBC, UOB’s big sell-off: Was it their Q3 numbers or a broader market de-rating?

Could Japan trigger the next global financial crisis?

Philippines’ FDI slowdown exposes uneven investment prospects across S-E Asia

